
I am pleased to forward 5’s first quarter overview of the energy market.
In some quarters we struggle to select the key energy issue or issues to be discussed. In Q1 2014, the choice was an easy one. Unprecedented cold weather gripped a large portion of the US this winter. The polar vortex impacted almost all de-regulated energy markets. After the first bout of arctic air flowed down from Canada, Eric Plateis, our resident market guru and Chief Risk Officer, stated in our weekly market report that when the weather gets very cold, it tends to stay that way for a long time. That is exactly what happened. Energy markets are still digging out, and regulators are exploring ways to avoid a similar spike in natural gas and electricity prices next winter.
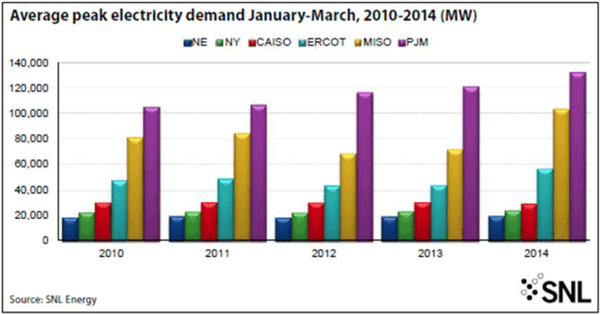
The polar vortex broke many records. The largest grid operator, PJM, announced that 8 of the 10 highest winter demands for electricity ever recorded in this region all occurred last January. This trend continued for the next two months. The first quarter was the coldest quarter since 1985, and twelve states counted the period among their 10 coldest on record. Peak electricity demand reflected this weather pattern throughout the affected regions of the country.
Our experience in running some of the largest deregulated energy companies in North America taught us to fear many things. Near the top of the list were: (i) unexpected events that strained the energy supply system (hurricanes, transmission failures, droughts, hot weather, cold weather), and (ii) markets in transition. In both cases, energy markets often respond dramatically and in ways not predicted by risk models, which generally use historical prices and events as an indicator for future events. This winter, a market in transition to a new natural gas based infrastructure collided with a multi-regional cold front, straining the energy supply systems to a point of near collapse.
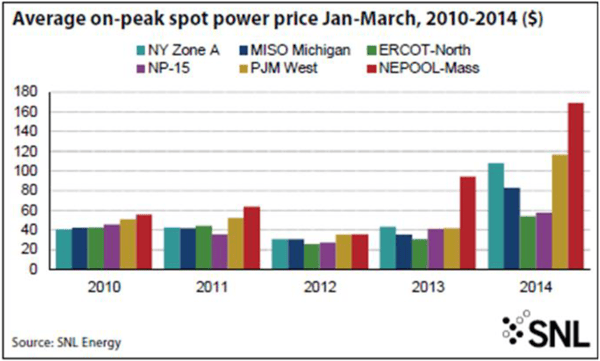
In previous newsletters, we warned of the risk of extreme (black swan) events on an electricity market that is increasingly dependent on natural gas and intermittent resources. The following chart shows how power prices increased dramatically in almost all markets this winter. We saw similar (although not as drastic) moves in long term forward prices as well.
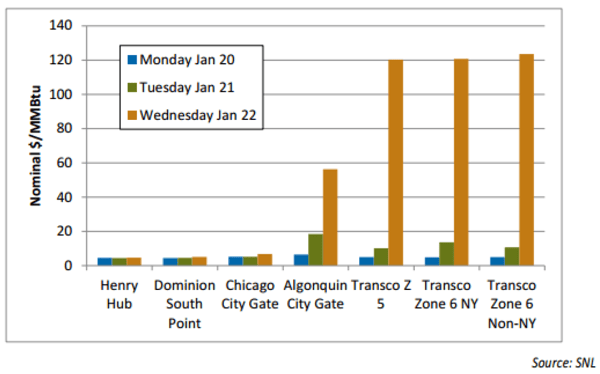
The story in the natural gas market was equally dramatic. In late January, gas prices reached record levels in certain eastern markets. The January 22nd price at Transco Zone 5 and 6, two large natural gas trading hubs, were at or above $120/MMBtu. This was a premium of 2,250% to the Henry Hub price on the same day.
Retail consumers that had not insured against these risks and were on products that exposed their electricity price to spot market prices felt the full force of these price spikes. The energy market did not function effectively and the investigation into what happened and how to avoid a repeat of last winter’s crisis is underway. State and federal regulators are casting a wide net in the search for answers. The forensic evaluation has begun. While we do not have any definitive answers, there are already a few key suspects.1
Forced Outages: Numerous power plants claimed a “forced outage” and did not operate at key times during the polar vortex. A forced outage occurs when a plant cannot operate due to unplanned equipment or other operational failures. During the early January cold snap, 38,309 MW in PJM, 20% of installed capacity, claimed a forced outage. The prior record for winter forced outages in PJM was 16,127 MW, 9% of installed capacity. 2 The unprecedented failure of nearly 40GW of PJM generation highlights a number of risks in the PJM market. Most importantly, PJM uses a capacity market as a means of guaranteeing sufficient generation to meet demand. In a capacity market, generators are paid annually for being available to run if called on to meet demand. The PJM capacity market does not require these capacity resources to contract for a firm supply of natural gas. Up to a third of the outages in PJM were not caused by equipment malfunction.
Rather, the power plants were unable to run because they had not contracted for firm gas supply. In gas markets, a purchaser can lower the price of natural gas by contracting on an interruptible basis. Interruptible supply gives the supplier the right to curtail shipments of gas when there is insufficient pipeline capacity to deliver such gas. During the polar vortex, power generators that had purchased firm supply received gas and ran. Many of those that had purchased the less expensive interruptible supply were shut off and could only run if they purchased much more expensive gas on the spot market. PJM may need to reconsider its capacity rules or at least discount the availability of the portion of its generation capacity that does not have firm gas supply.
Low Price Caps: The problem caused by capacity resources being qualified without firm gas was compounded by a market unwilling to allow scarcity to set price. In Texas/ERCOT, there is no capacity market. Instead, the market depends on the prospect of very high energy prices at peak periods to incentivize sufficient generation supply. In this market, owners of generation can offer to sell generation at prices up to $5,000/MWh. The cap goes to $7,000/MWh this June and in 2015, this price cap goes up to $9,000/MWh. In PJM, the maximum offer price that a generator can bid is only $1,000/MWh. PJM regulators may have assumed that they could use a lower (and more politically palatable) cap because their capacity market assured sufficient supply. As noted earlier, that was incorrect.
At gas prices of $120/MMBtu, which we saw this winter, the fuel cost to operate a typical peaking plant (the less efficient plants that system operators depend on running at times of peak demand), far exceeds this cap. A peaker plant with a 15,000 Btu/kWh heat rate would need an electricity price of $1,800/MWh just to cover the cost of fuel for running the plant (operational costs are additional). A generator forced to buy gas for its generation facility at $120/MMBtu and generate power at $1,000/MWh, would operate at a loss of $800/MWh on fuel costs alone. This is exactly what happened in January. Generators that did not buy firm gas or use other structures to hedge natural gas prices (locking in a price that was low enough so they could operate at a profit within the $1,000/MWh bid cap) were unable to meet PJM's dispatch request.3 Rather than forcing these generators to run and absorb these economic losses, PJM told the generators that they would be compensated retroactively for fuel costs above the offer cap. These uplift costs will now be passed on to consumers. This effectively punished those capacity resources that had hedged their fuel purchases. This is another example of why price caps, particularly ones set at relatively low levels, are inconsistent with a free market and compromise the market’s ability to adequately respond to price signals. We are not sure what other steps PJM will take to address this issue; however, they are likely to result in more costs being passed on to consumers.
Curtailable Load: Demand response resources or DR (customers that are able to run stand by generation or curtail consumption at times of peak energy usage) is a low cost and environmentally friendly way to meet an electricity grid’s summer peak demands. Such DR resources now account for half of PJM’s planning reserve margin. Unfortunately, approximately 80 percent of that capacity is only available in the summer. These resources cannot be counted on to meet peak winter demands. In spite of the fact that such summer only demand response resources (for example, the ability to turn of air conditioners during peak hours) cannot support the system in winter months, DR generated capacity is paid the same capacity price as generation resources that can run in the summer and the winter. PJM must take a long look at how DR resources are counted and compensated when it calculates its reserve margins going forward.
Coincident Events: Finally, it appears that system operators assumed that forced outages were independent – an operational problem at one plant was unique and unlikely to occur at multiple plants at the same time. This winter challenged those assumptions. At times of extreme cold, forced outages are in fact related. Again, PJM and other grid operators will need to change some of their basic assumptions to insure that the system is not vulnerable to future events comparable to the polar vortex.
As discussed, the recent winter is sending strong signals to regulators to re-evaluate the grid’s increasing dependence on natural gas fired generation. At the same time, environmental regulation is continuing to increase the nation’s reliance on natural gas generation. Nearly 23,000 MW of coal-fired generation was retired in the United States between 2009 – March 2014. According to SNL Financial, “that number is already on track to more than double between the remainder of 2014 and 2022.” On April 15, 2014, the Court of Appeals in the District of Columbia upheld the EPA’s new Mercury Air Toxic Standards (the basic legal challenge was that the EPA had not considered the cost of operating coal fired plants under the new standards).
As the chart below reflects, implementation of the MATS standards will accelerate the retirement of coal plants.
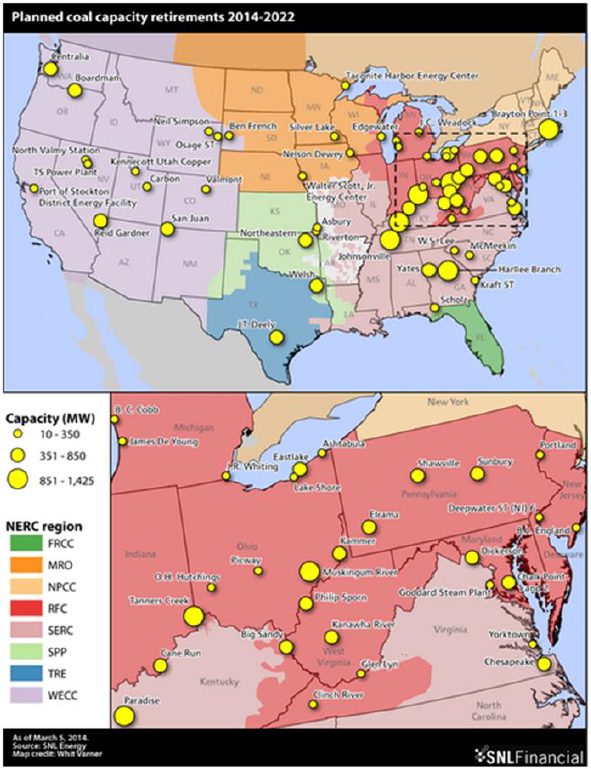
If all of this coal fired generation had been retired prior to this past winter (and if some of the nuclear plants scheduled to shut down had not been in operation), we would likely have faced significant outages in Q1 2014.
For the last 12 months the strategy team at 5 has been urging our clients to be pro-active and hedge some or all of their exposure to long term natural gas and electricity prices. While gas and power prices have moved up significantly during and after the polar vortex, we believe that the steps regulators will take to address last winter’s problems are likely to place additional costs on consumers and generators in the near future.
Of course, if you have any questions about the issues discussed in this letter or other questions about the energy market, please do not hesitate to contact me or other members of the team at 5.
2 The same high level of outages was seen in the Midwest (MISO), with 28,736 MWs offline, 22% of its total generation.