
Market Info & Updates

Topics: NYISO
Industries: All industries
Wholesale electricity prices in New York have been falling for the past several years. Figure 1 shows how the price of electricity in New York City, for the period March 2020 to April 2021, has traded over the last six years. This chart shows that prices have fallen from a high of $80/MWh in the summer of 2014 to current all-time lows of $32.56/MWh. One might assume that these low wholesale electricity prices would translate into lower retail electricity prices. Wholesale electricity is only one of several other pricing components that make up a retail electricity price. After electricity, the next largest price component is Capacity and, unfortunately, Capacity prices have risen dramatically in New York City.
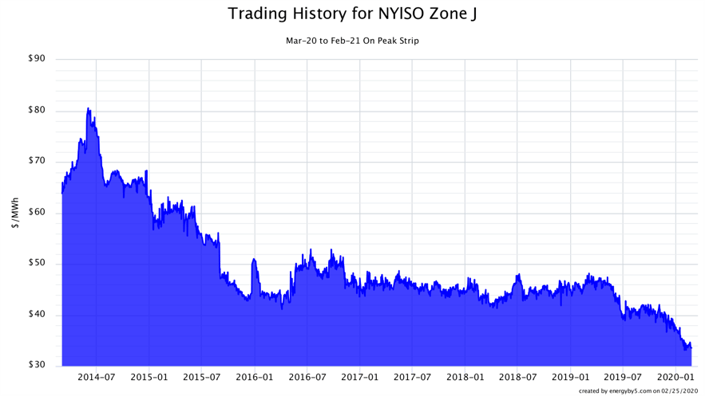
Figure 1: Trading History for NYISO Zone J, by 5
Figure 2 shows the cost components of a typical retail electricity offer in New York City. Wholesale electricity is shown in blue and capacity is in gray. For a retail electricity price of 7.5¢/kWh, approximately 3.0¢/kWh is from the cost of capacity. Note that capacity costs are similar in magnitude to the cost of wholesale electricity.
Capacity in New York trades by calendar month, but the prices for these months are established through a winter (Nov-Apr) and summer (May-Oct) auction. Figure 3 shows how the summer of 2020 and the winter of 2020/21 have been trading in the forward market. The price for capacity in the summer of 2020 has been steadily increasing away from its floor of about $9/kW-month in 2018 and early 2019, to highs of $18 to $20/kW-month, an increase of about 100% over a two-year period. Capacity prices for the winter of 2020/21 have also been climbing from approximately $2.50/kW- month to about $7.50/kW-month, an increase of 200%. 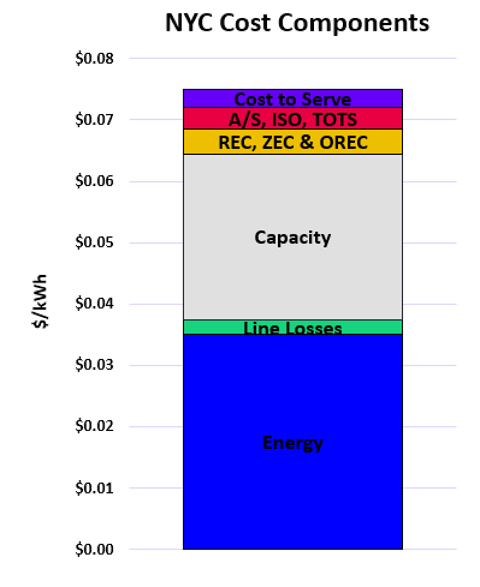
Figure 2: NYC Cost Components, by 5
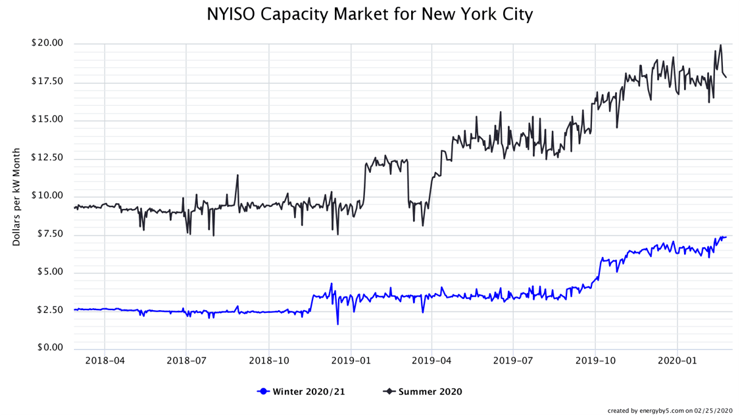 Figure 3: NYISO Capacity Market for New York City, by 5
There are three main drivers for this increase in capacity costs
- the upcoming retirement of Indian Point Unit 2 this April
- the mandate for suppliers in NYC to purchase more “in zone” capacity, up from 82.8% to 86.6%
- the overall increase in statewide capacity obligation due to an increased Reserve Margin target of 18.9%, up from 17%
All three of these factors either reduce supply or increase the overall demand for capacity in New York City, which in the short-term is limited in quantity. When supply cannot quickly increase with demand, it puts significant upward pressure on forward prices as shown in Figure 3. Clients in New York City need to be prepared for higher electricity costs beginning in May 2020, regardless if their capacity is purchased in the forward markets in the form of a fixed price or if it is purchased at the monthly auction clearing price and passed through from a supplier or through the utility.

 Nov. 17, 2026
What El Niño and LNG costs could mean for winter energy prices
 Oct. 9, 2026
Winter 2026-27 Outlook for Gas and Power Markets: 5 Things to Know from our Live With 5
 July 31, 2026
5 Things to Know From Our Webinar "How Data Center Growth is Reshaping Power Markets"
 May 20, 2026
5 Key Takeaways from Our "Navigating Energy Markets and the Middle East Conflict" Webinar
 April 14, 2026
Coincidental Peak Alerts
 March 10, 2026
Webinar Recording: “What’s Behind Your Energy Bill: Understanding Energy Costs in NYISO"
 Feb. 24, 2026
Watts Next? 2025 Lessons and 2026 Predictions
 Jan. 22, 2026
Webinar Recording: “Demand Response: The Energy Strategy Hiding in Plain Sight"
 Dec. 9, 2025
The Coming Surge: What Large Energy Users Need to Know About 2026 Electricity Prices
 Aug. 20, 2025
August 2025 - Energy Market Letter
 Jan. 14, 2025
WINTER POWER OUTLOOK: RELIABILITY & RISK ASSESSMENTS ACROSS KEY MARKETS
 Aug. 29, 2024
SUMMER 2024 MARKET REVIEW